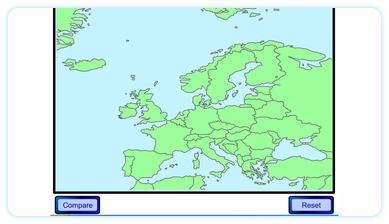
 Teach your maths students how to compare positive and negative numbers using your Interactive Whiteboard. Primarily useful as a method of questioning a class. A map of Europe is presented on the whiteboard. Clicking on a country produces a note showing the name of the country and its average January temperature. Clicking on a second country produces the same for it allowing the temperatures to be compared. Europe’s widely varying winter temperatures allows the teacher to question students on the difference between given negative and positive numbers.
Go to learning resource
Get instructions
Truly amazing like all the other resources. I am a huge fan of yours and wish I had discovered you sooner. Teaching has been a pleasure this week. Planned as starters but as we have all had such fun, it went on and on and on and we all LOVED it!
Can you come up with one of around the world temperatures as I am trying to be reach all the culturally diverse backgrounds in my classroom.I love all of your sites.
Thanks for the suggestion but you may have to wait for that one. A world map was the original intention but the map becomes very small. Also the making becomes a huge task as I have to draw each individual country and enter it’s data. Perhaps I’ll find a way eventually.
This tool and your number line are wonderful! Thanks
Have only just discovered your resources – can’t wait to try them out!
nice
Hi, I love this resource
Is it possible to download, since IWB in school has no internet access?
Thanks