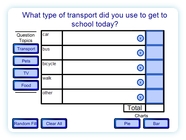
 Conduct a class survey from your interactive whiteboard. Demonstrate the use of tallies and frequency charts. Immediately generate a pie chart and bar chart from your results and compare how useful they are in presenting data. Random data can also be generated.
Get instructions
See the instruction sheet for details of use.
This is fantastic for the starter of a maths lesson.
Very impressed!
Hi, thats fantastic! But is it also possible to edit the survey? How can I do that? Please mail me, its quite important for a presentation! Thanks a lot!
pat
Thanks. Sorry it isn’t possible to edit the questions. Editing questions requires needing to use the keyboard and I try to make all of the resources fully operational from the IWB. I know there is an on-screen keyboard but it is a lengthy process to fill it in during the lesson. The latest version of Flash allows saving soI’m looking at going back and adding the facility to modify and save in advance but that will require a total rewrite of this resource so a little way off yet I’m afraid.
Great little resource – I could even use it more if it had standard graph labels. Could then show and teach how to make a correct graph. Thanks
It’s no good if we can’t modify it to make it relevant for our students.
Thanks for your comments. I’ll explain the design decisions behind the resource. I would welcome a response to inform future revisions of the resource.
I woud question whether it is “no good”. Of less use perhaps but I would still think that it has use. As mentioned in an above comment there is a reason you can’t edit it and that is because I try to make all of the resources fully usable at the IWB without using the keyboard. To start editing as you go would not be a smooth affair from the IWB.
There is a trade off between flexibility and ease of use. The purpose of this resource is to allow you to be able to generate different data and display it very easily. In this way you are not restricted to a fixed set of preprepared data and can give as many examples as you see fit. You can show a survey without very much preparation work. This is easy to use and do. More flexible would be to allow you to craft your own surveys, label your own graphs, define the size of the axis and amount of categories,, indicate whether the data is contiguous or not, and pie chart to fit a survey of your design. But each survey would require you to do this and typing in while teaching takes the teacher’s attention away from the class. So you could prepare it in advance but does the resource then offer much more than what you could do with the IWB software you already have? Or Excel with which you can do everything this resource can and more – but it isn’t so easy to use. It certainly becomes less of a time saving resource in terms of preparation as you more towards a full on application rather than a very targetted IWB resource for a very specific demonstration task.
That being said those are my design reasons they may not stand up to what users want. Others may agree with you. Future revisions of this may allow what you require. people should let me know how useful they would find this.
@Steve How do you mean standard graph labels? If I’m not following a correct convention this could be easy to fix.
Spencer
It needs to be editable – think along the lines of the Smartboard Flash Objects found in the Lesson Activity Toolkit 2.0. The questions are prepared and the survey is taken at the IWB.
This is a great resource, I just want to say thank you.
A fantastic resource as are all of the other resources on this site. Thank you.
What a shame ‘anonymous’ can’t find the good grace to acknowledge that what you produce does have many uses and is also free!!
I am so thankful for your resources. I spent ages trying to create something like this and it came no where near what you’ve done. Can’t wait to get back to work and use these with my kids in Year 3.
I think this resource and all materials on this website are of a very very high quality.
I think you are correct to make them as usable as possible at the IWB. Some ‘interactive’ resources are restricted, but despite some limitations, I think you are making good design decisions.
Thanks for providing these free, I will definitely be using them and sharing will colleagues.
Alex
Fantastic!!!
Brilliant piece of software- I’ve used it 4 times now as a ‘getting to know you’ tool for classes (right the way from years 7 to 10).
I ask for everyone to say their name then their favourite tv show in rapid sucession (you get to show you’re human when someone slips up and says them in the wrong order- I still call one of my year 8s “Hollyoaks”!). Then you can get your formative assessment on with questions building up from “What does frequency mean?” to “How many degrees will this be on the pie chart?” and “Why?”.
Thanks for all the great lessons,
Tom
P.S. Any chance you could put some angle labels in degrees on/with the pie chart pull out- or would that look cluttered?
Thanks for taking the time to describe how you use it – I’m sure that will help others. I programmed this one a while ago and I can’t remember how the pie chart is generated so I’ll need to look into labelling the angles on the pie chart and whether it is possible.
I love it – perhaps you could also add a line graph and a divided bar graph?
This is a fab resource for introducing children to data handling, my lot will love this! Cassie M- good idea, line graphs can be hard for children to understand so having it on here so they see the same info presented in different ways will be great.
This is wonderful. I have been searching all over the web for this. I too REALLY need it to be editable. If I could create my own questions it would be perfect to use for Daily Data in my classroom. PLEASE consider making it editable.
Thanks for your work!
Again, fantastic resource!You have so many wonderfully useful activities that the children love!Thank you =)
This is amazing. About to start a data handling module with some weaker Y8 students and this gives me everything I need for the board. Many Thanks
A fantastic iwb resource for KS3 stats. I am going to use it with my year 7 group.